Data Modeler
COMPANY
Workiva
MY ROLE
UX Designer
SUMMARY
I lead the design for the Data Modeler which is one of five applications that make up the Database Toolbox. The app is designed to create customer data in the Workiva Platform so it can be leveraged in auditing and reporting.
ABOUT THE COMPANY
Workiva's vision has always been to modernize the way customers manage business data by connecting collaborators, documents, and spreadsheets. The platform allows structured and unstructured data to be aggregated and connected across reporting and compliance outputs, including presentations, spreadsheets, and reports.

BUSINESS PROBLEM
The Workiva platform is built to unify people, processes, and data to deliver accurate reports required by regulators, leadership, and shareholders
In order to leverage the platform for audit some setup is required in order to implement a solution and onboard a customer. Today internal employees perform customer implementations and onboarding. We have observed the type of experience needed to implement and onboard a customer causes friction with users after purchasing the product. Relying on internal employees to perform customer implementation is not scaleable and effects revenue.
How might we improve the onboarding experience so it can become customer facing and allow users to perform their own implementations?
SOLUTION
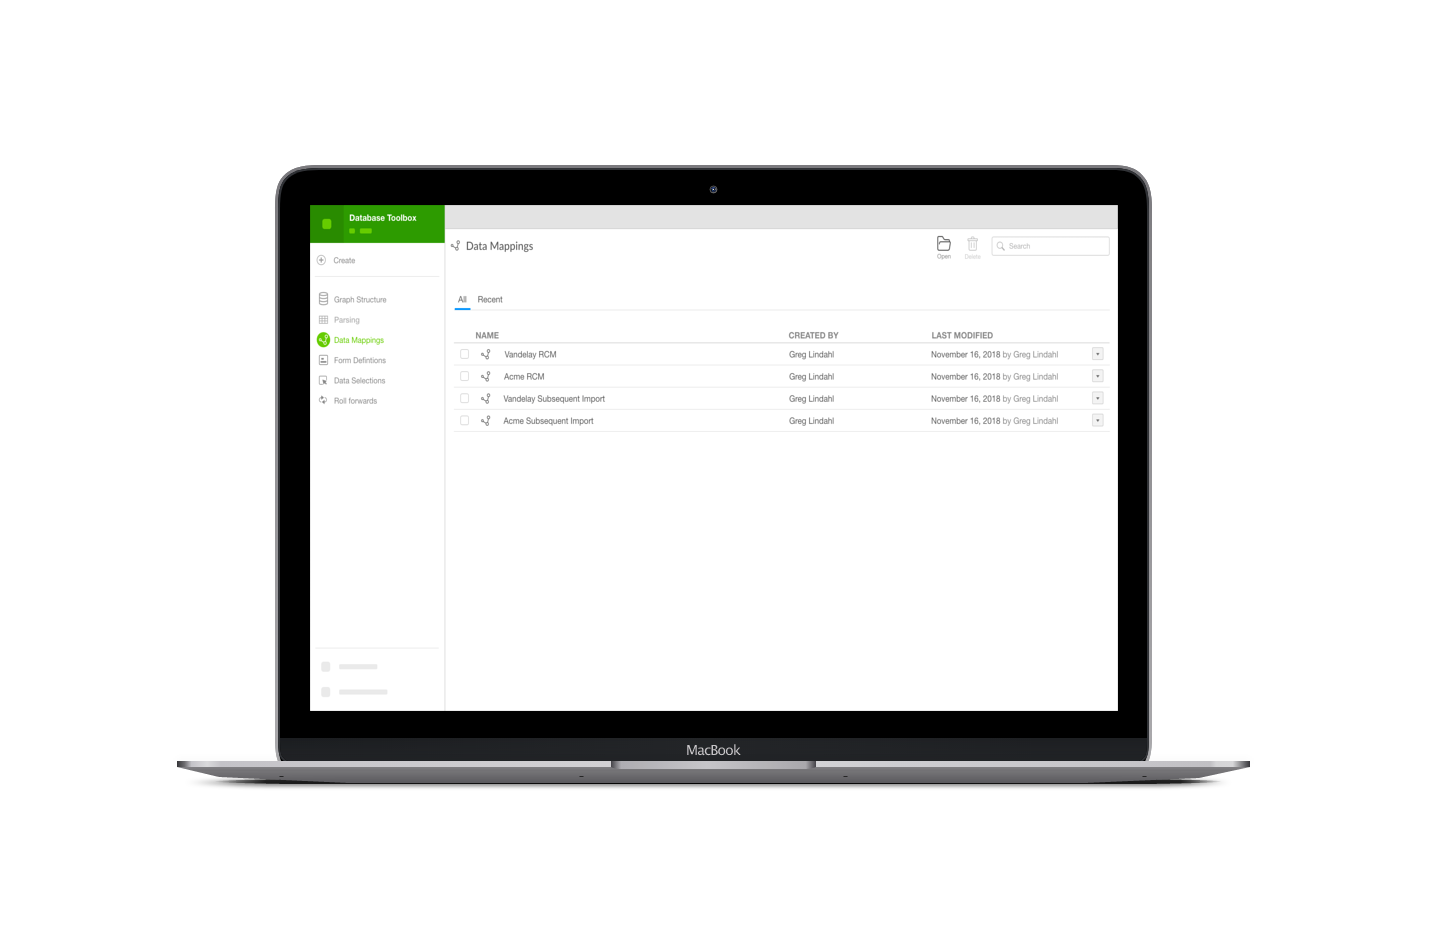
The Data Modeler application is designed to enable users to create records from a source and map them to data types in the Workiva graph database. Data Modeler also enables external users to do their own implementation without having to rely on Workiva Solution Architects.
PROJECT GOALS
- Reduce the cost of onboarding
- Provide tooling for customers to validate data prior to record creation
- Long term is to enable customers to perform their own implementations
RESPONSIBILITIES
- conducting user research, interviews, discovery, and competitive analysis
- facilitating Lean UX design workshop
- designing information architecture
- wireframing
- building clickable prototypes
- user testing
- collaborating with three full stack developers
- facilitating upward reporting to key stakeholders
- product management, roadmap, ticket creation
PROCESS
The design process started by defining high level business outcomes, user persona, hypothesis, and next steps with key stakeholders from client services and partners performing audits for their customers. Discovery on how the current customer implementation process provided guidance on how we might make this process more consumable for users. The current process involves a separate desktop application. Thinking about how this experience could be available in the Workiva cloud app is also something at the top of my priority list.
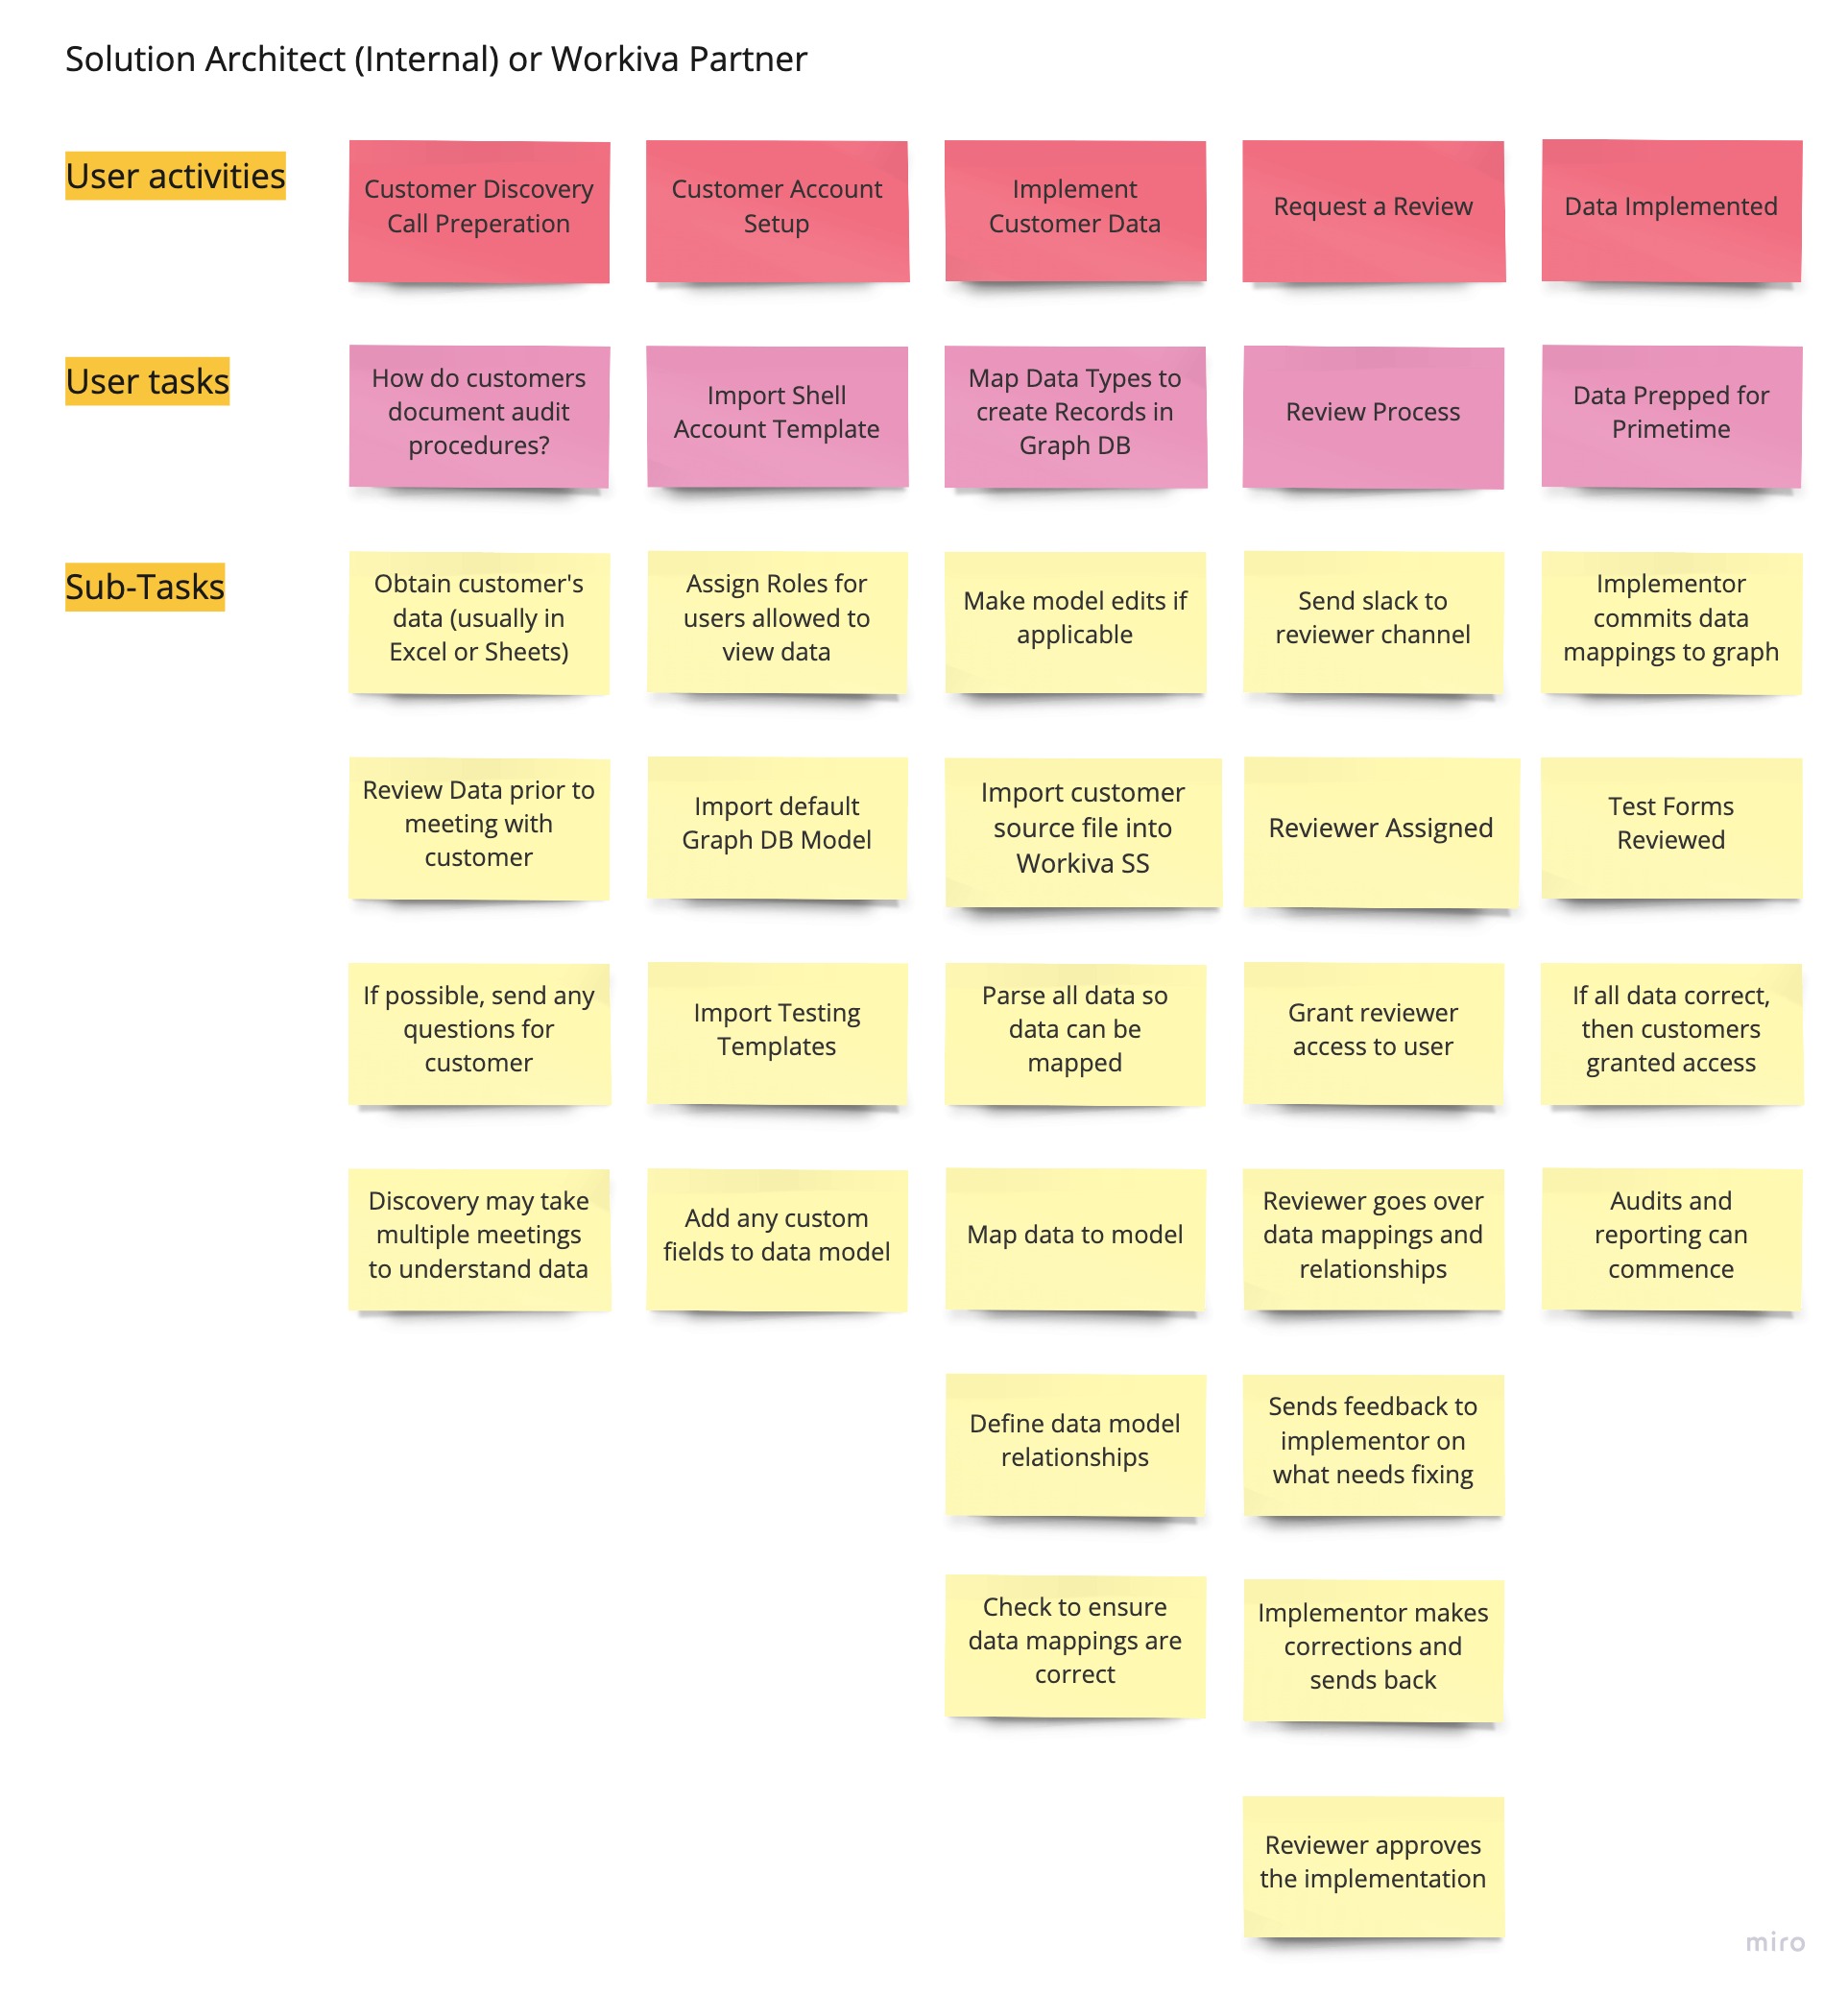
Utilizing a user journey map, we went through all of the steps of an implementation. We identified some clear pain points in the process, especially around the review process. Retrieving the customer data and cleaning it up was not the biggest challenge, but the validation of the data mappings prior to sending it for review.
We discovered that the review process is quite a manual undertaking. Our internal users send a slack asking for a review. A reviewer is then assigned, via the Slack channel. Then a back and forth process ensues regarding changes requested by the reviewer and resubmission by the implementor. These change requests are kept in a separate document from the project. This caused quite a bit time to be wasted having to switch back and forth from the data mapping and the document housing the feedback comments.
Workiva’s platform has collaborative tooling to assign users tasks and leave comments. The platform also contains a default history component that could also be leveraged to see who made what edits and when. We saw a clear opportunity to improve the review process my leveraging these tools in our solution.
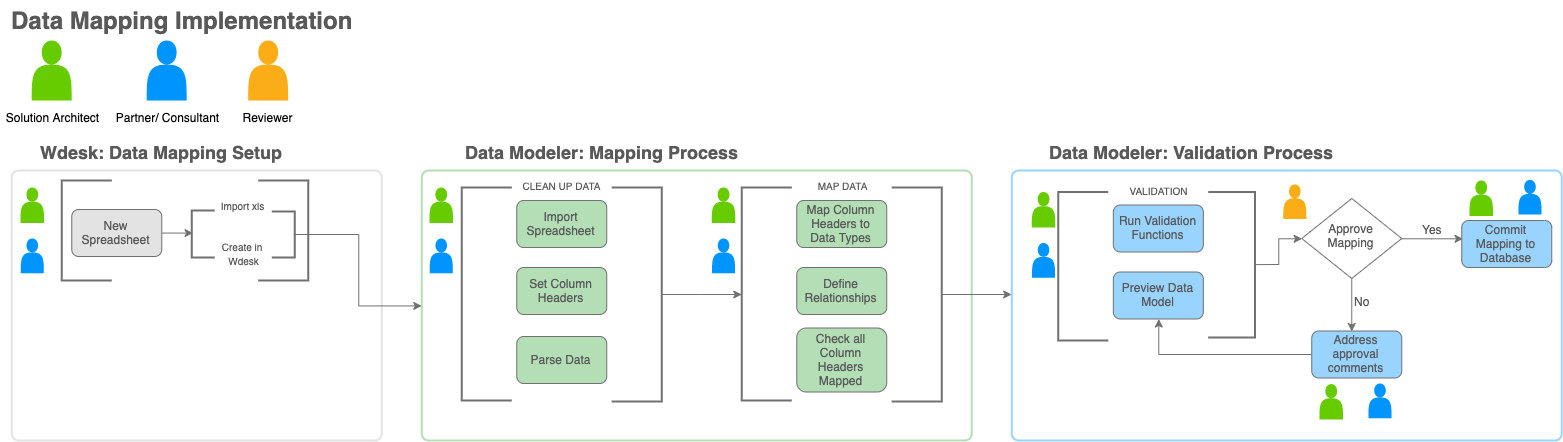
Based on the information learned in the user journey session, I began working on a user flow diagram.
The diagram provides an anchor point when I begin thinking about UI patterns and components. It also provided opportunity for discussion with the developers on the different services that may need to be written, as well as, any APIs that may need to be exposed to meet user needs.
WIREFRAMES AND PROTOTYPES
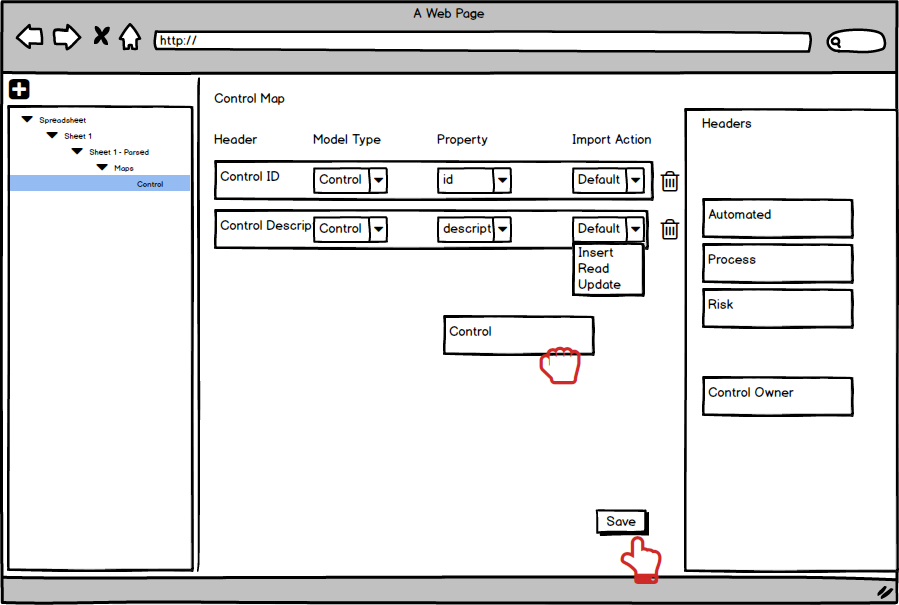
Sketching and wireframing began with ideation around how we might present the mapping experience to be more user consumable.
I learned that users are most concerned with mapping all of the column headers from a source spreadsheet to a data type. If any are missed, this will cause issues down the road.
I leveraged the outline panel to group headers and data types together so the user could quickly see a full data set view and more detailed view.
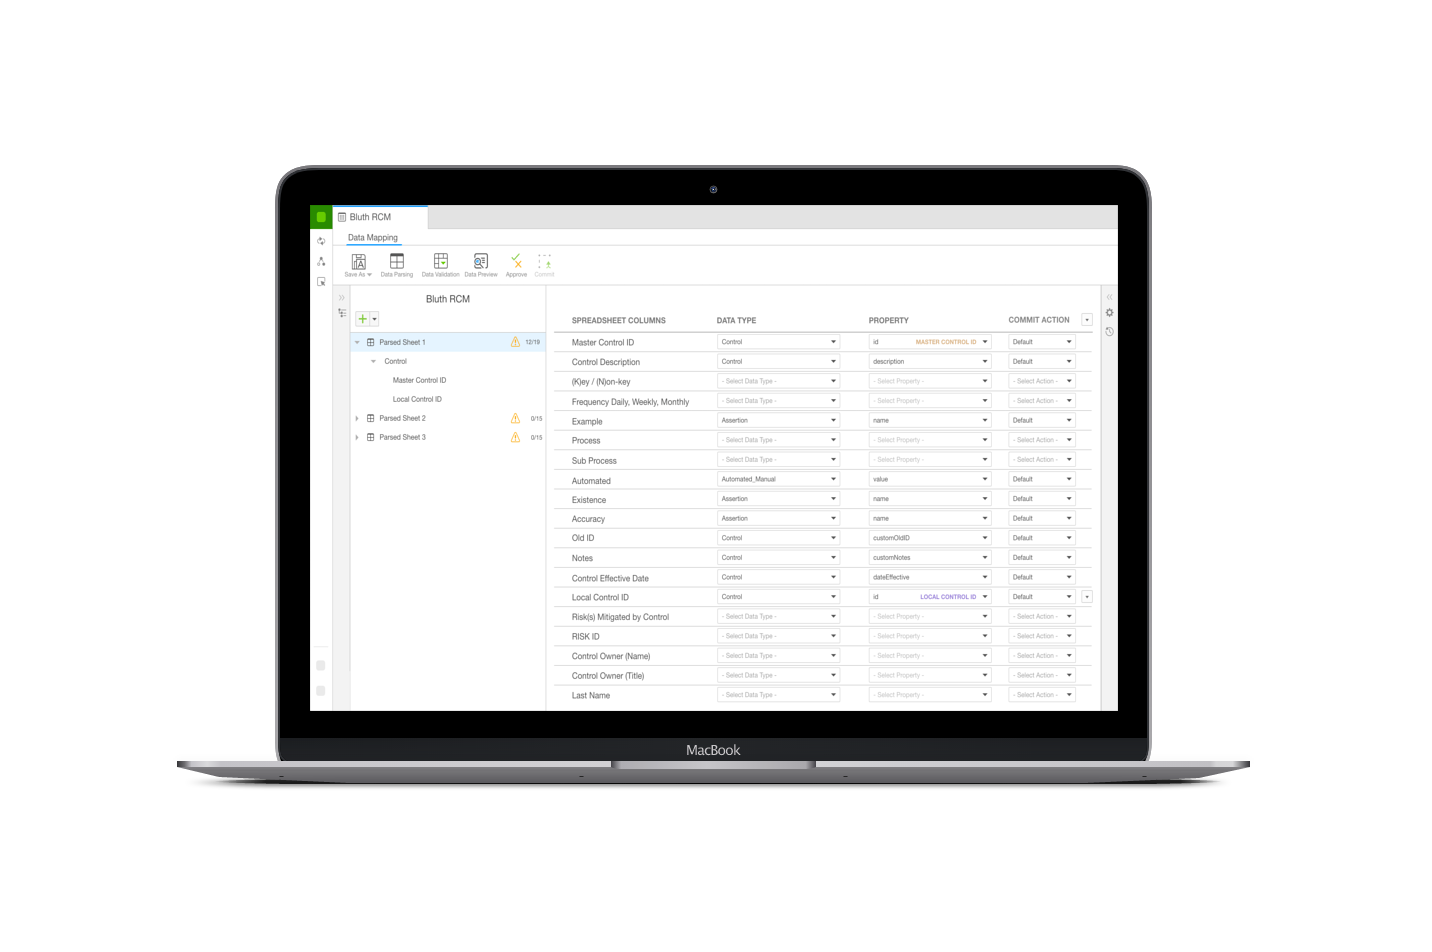
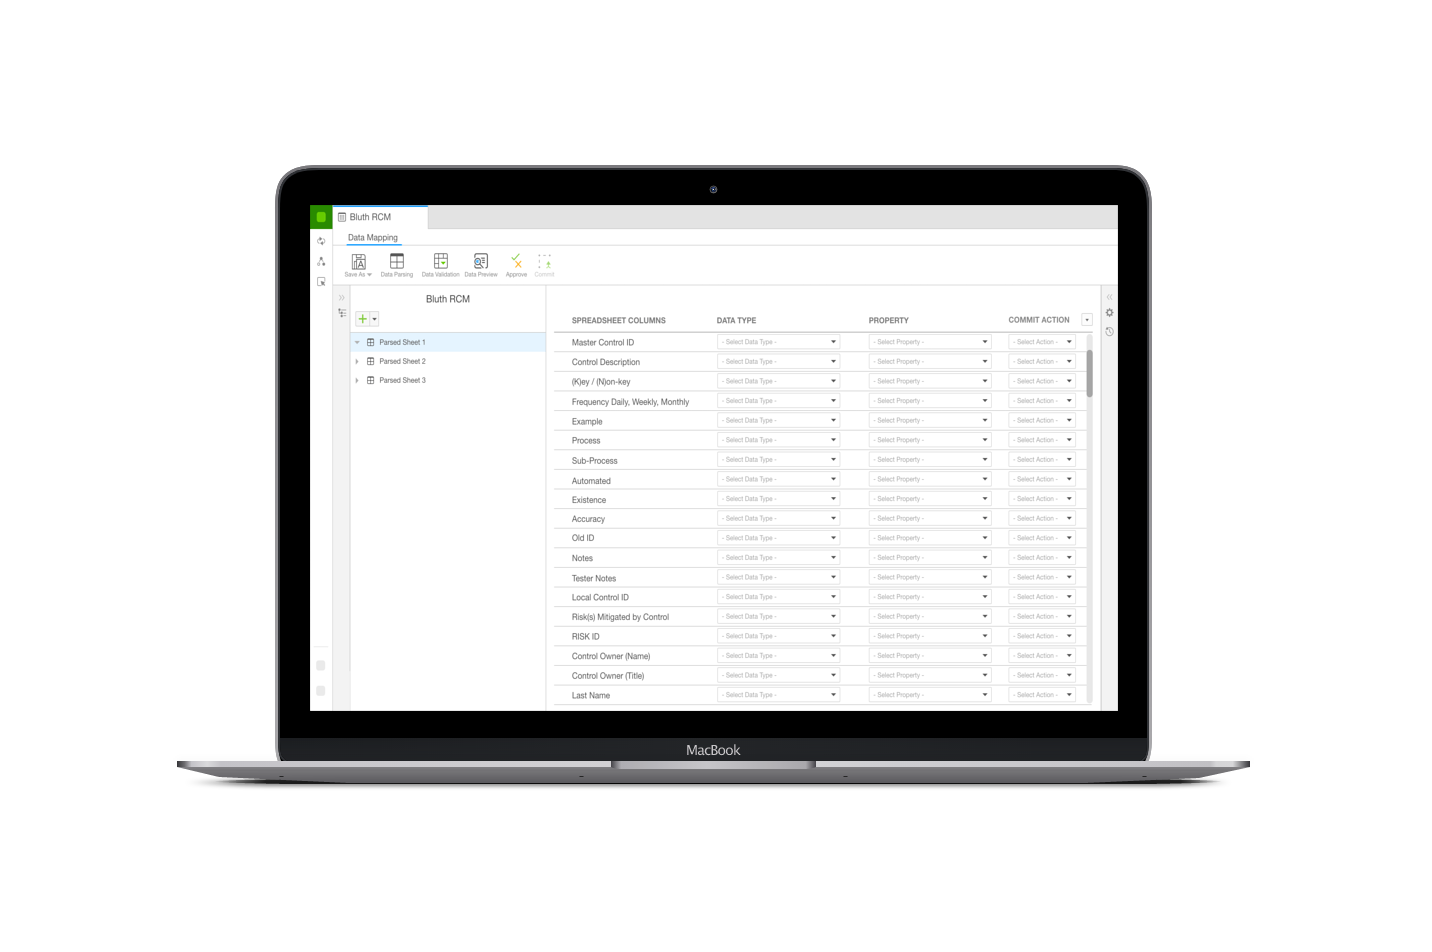
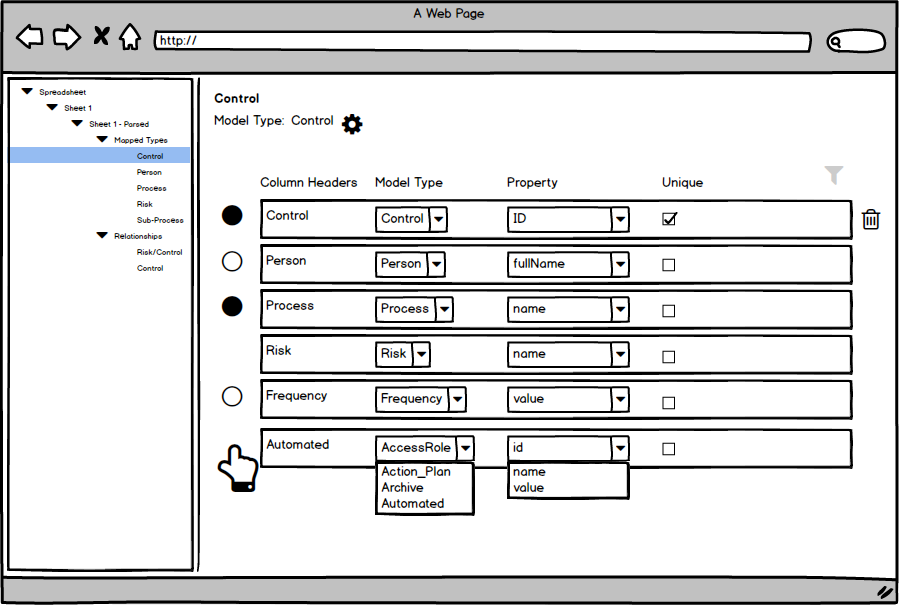
DATA MAPPING
Speed and effiency is important to users. Using a table that she can tab through and quickly map headers to data types is essential.
This was the single most important piece of feedback received during user testing. Users also appreciated the clean layout and easy navigation the outline panel provided so they could quickly jump to other source sheets.
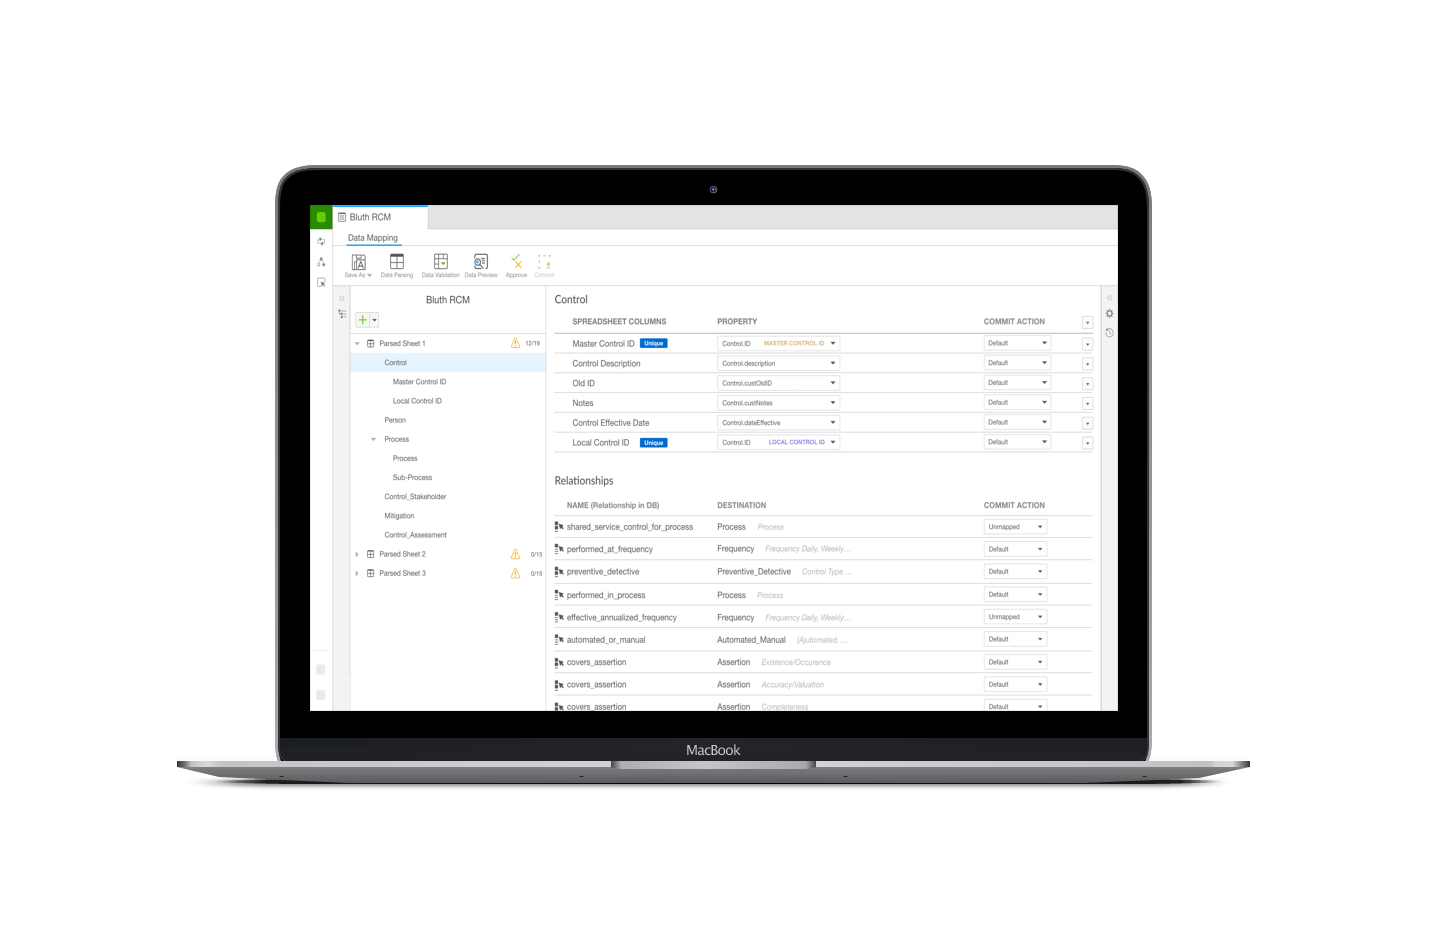
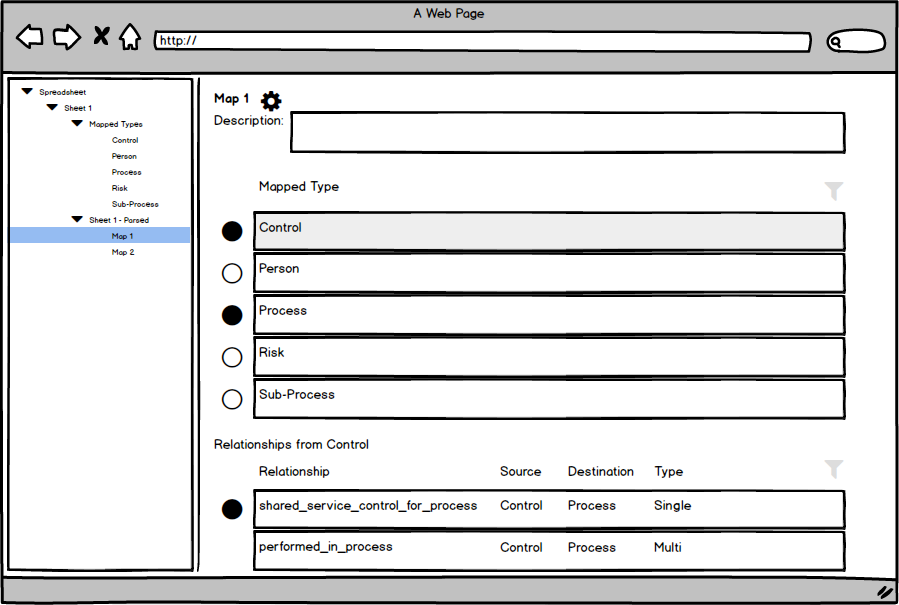
DETAILED VIEW OF MAPPED DATA TYPE
Having the ability to see headers mapped to a particular data type also came out of some user testing and ideation with users. This view provides a scannable list of all the individual properties mapped within a data type. Users can see all things related to the data type and modify as necessary.
Defining the relationships for each data type is also shown on this view. This reduced the number of relationships a user would need to define at one time, which can add up quickly. Using the outline panel, users can quickly navigate back to the parent level sheet and perform any subsequent mappings.
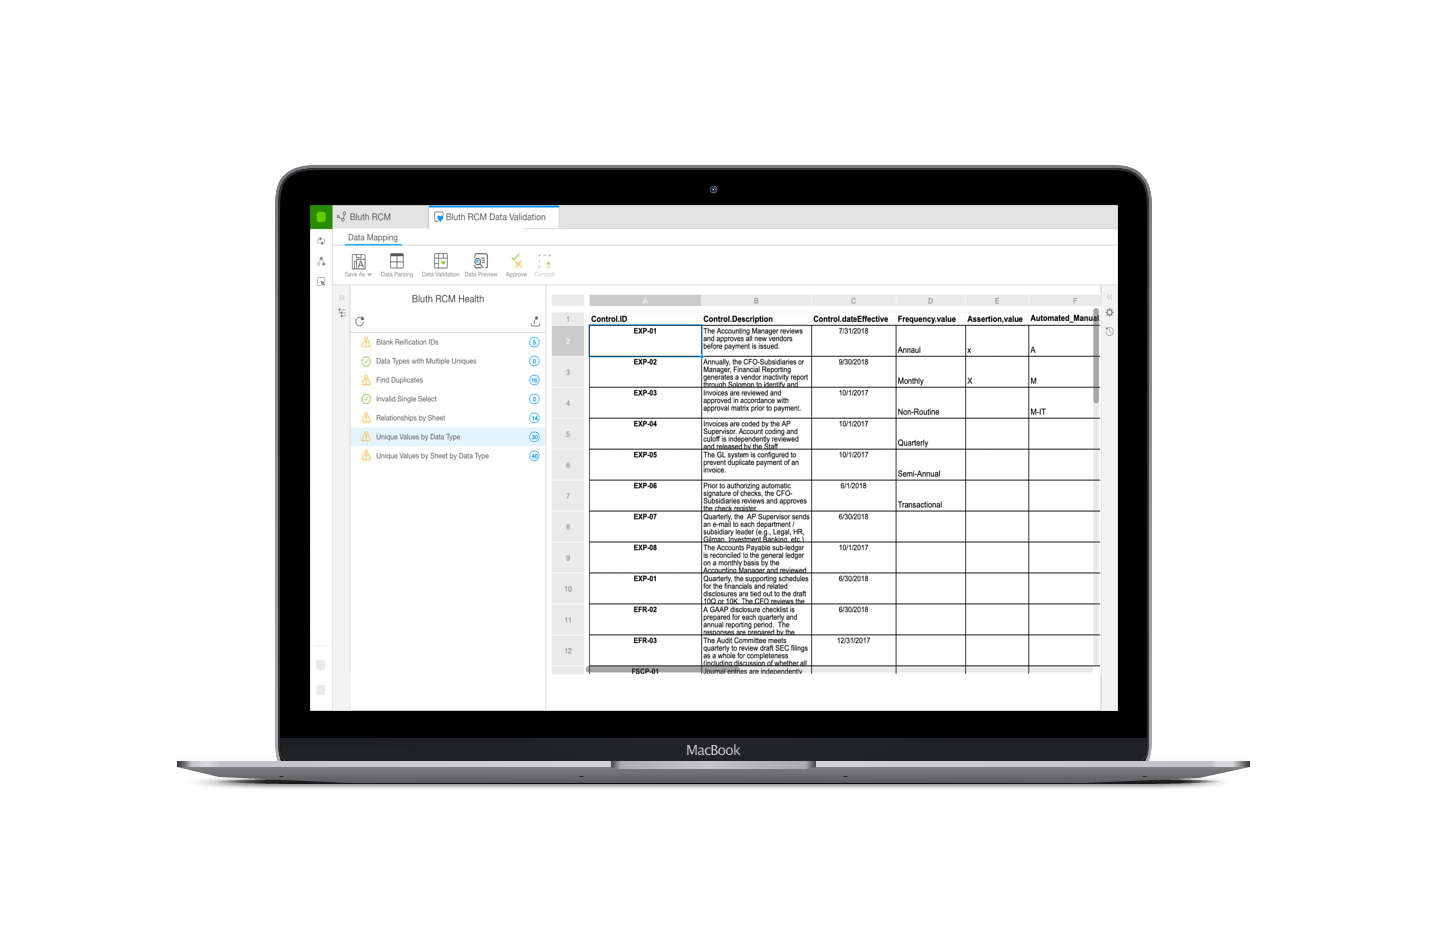
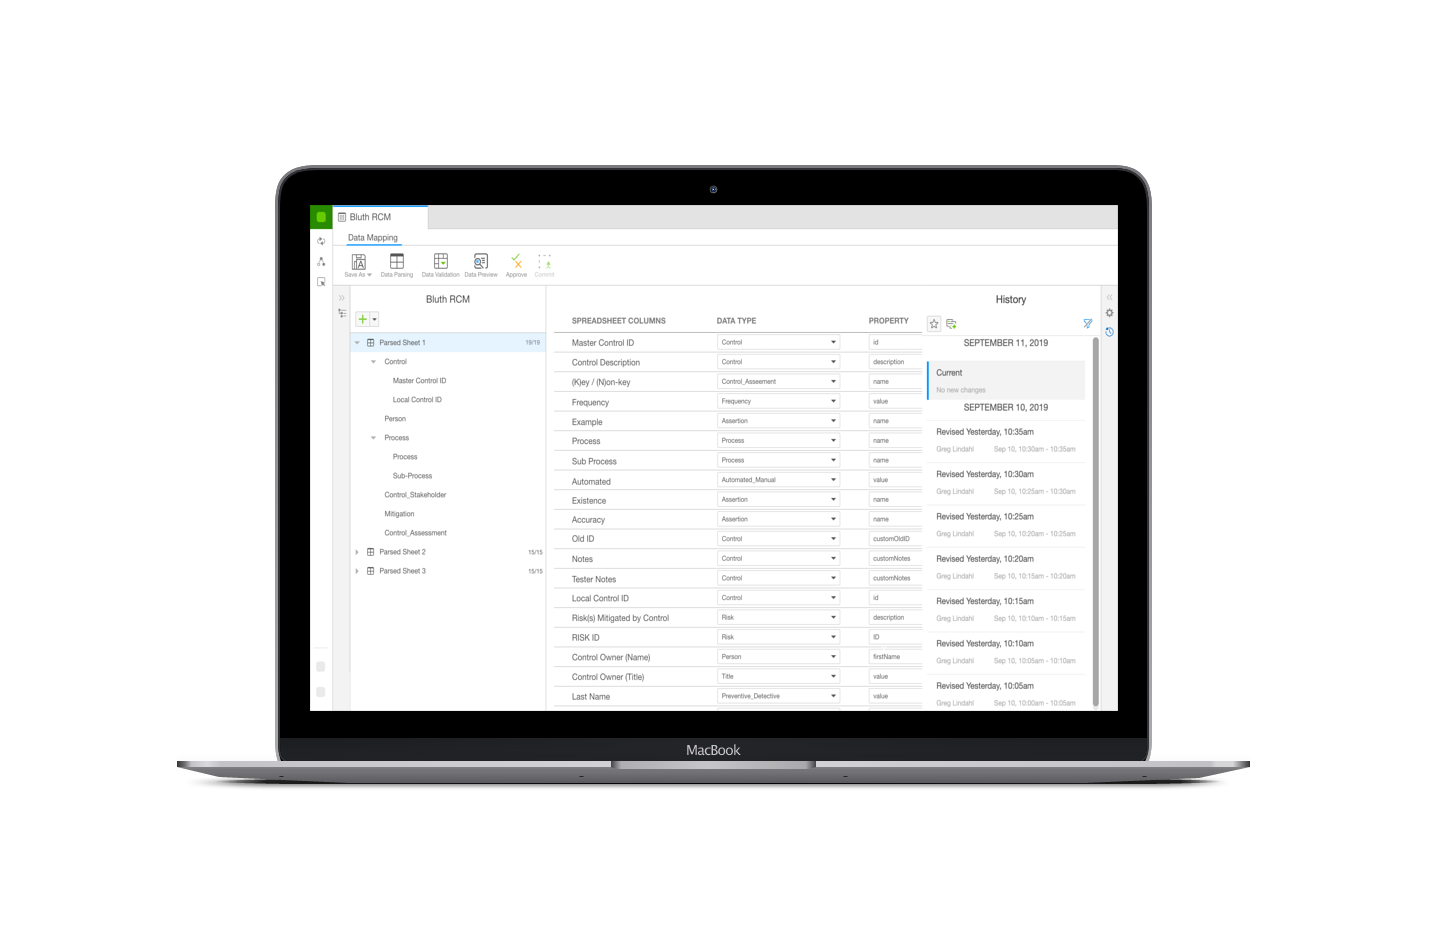
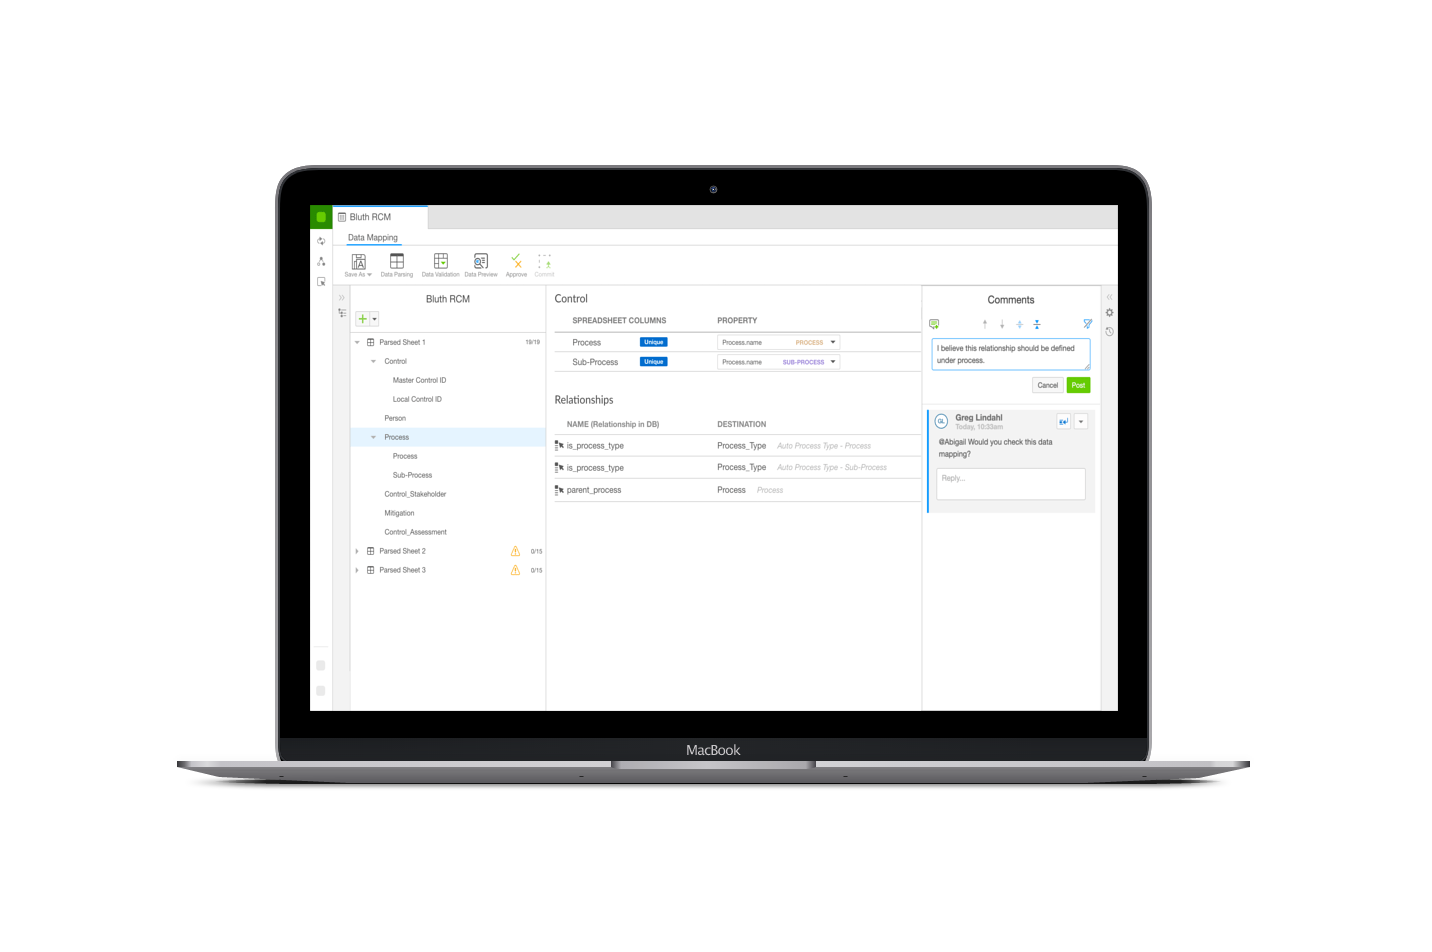
VALIDATION AND COLLABORATION
Providing validation tooling was a key feature for the minimum viable experience. Lack of validation was slowing users down during the approval process as they were not sure what was wrong with the data.
Validation functions can be run against the data set prior to requesting an approval. This provided an initial feedback mechanism so users could fix errors prior to the request. We kept the data as close to the source sheet experience as possible as our users tend to work in spreadsheets. I leveraged the current history and comments components to add collaboration tooling for the implementor and reviewer. This saves time on the implementation which reduces internal costs.
I plan on learning from the initial tooling experience so improvements can be made prior to exposing it to customers.
ACHIEVED METRICS
- Saved users an average of 12 hours a week due to validations feature providing feedback prior to requesting an approval
- Kept users in the Workiva platform instead of having to switch between a separate desktop app and the web app making the process more efficient
NEXT STEPS
- Collect feedback from internal users and partners on the current experience and determine what improvements we can make to better the data mapping process
- Prioritize features for discovery based on what we have learned from internal users and partners in our preparation for exposing the application to customers
SELECTED WORKS
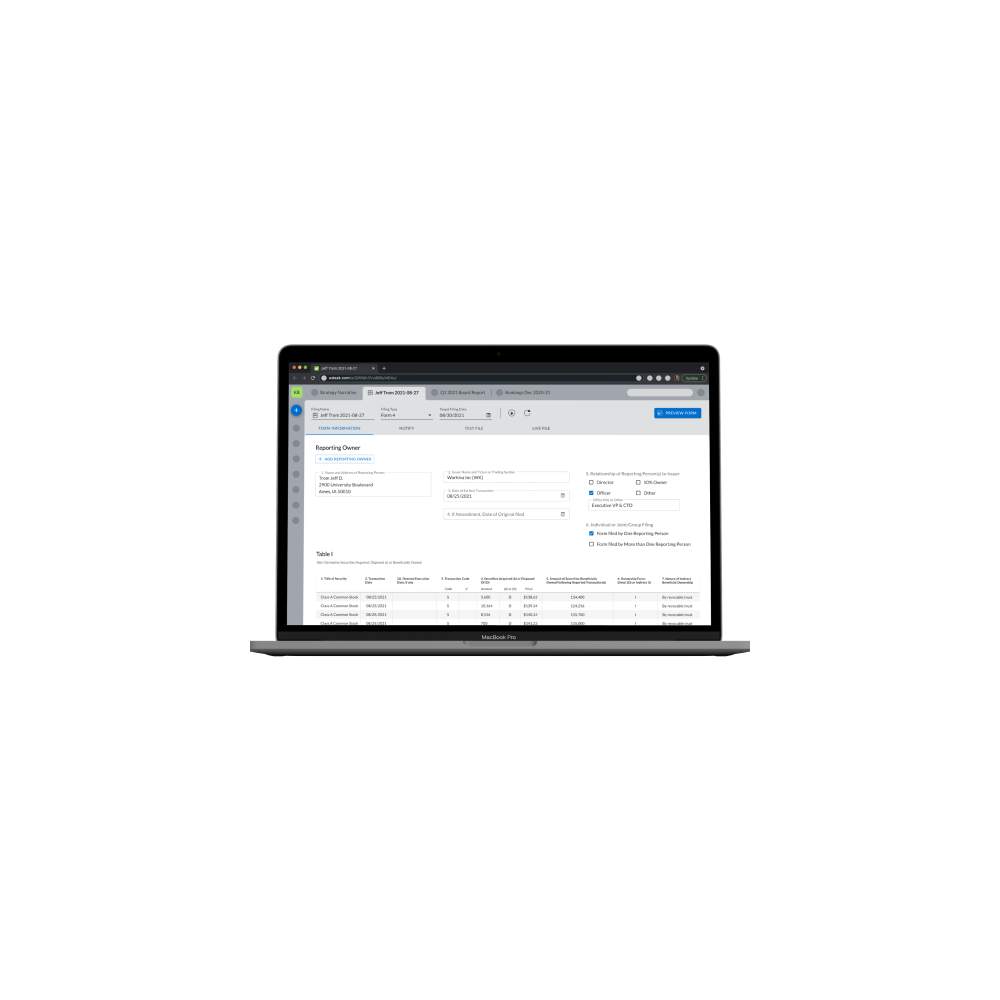
Section 16 ReportingApplication Design
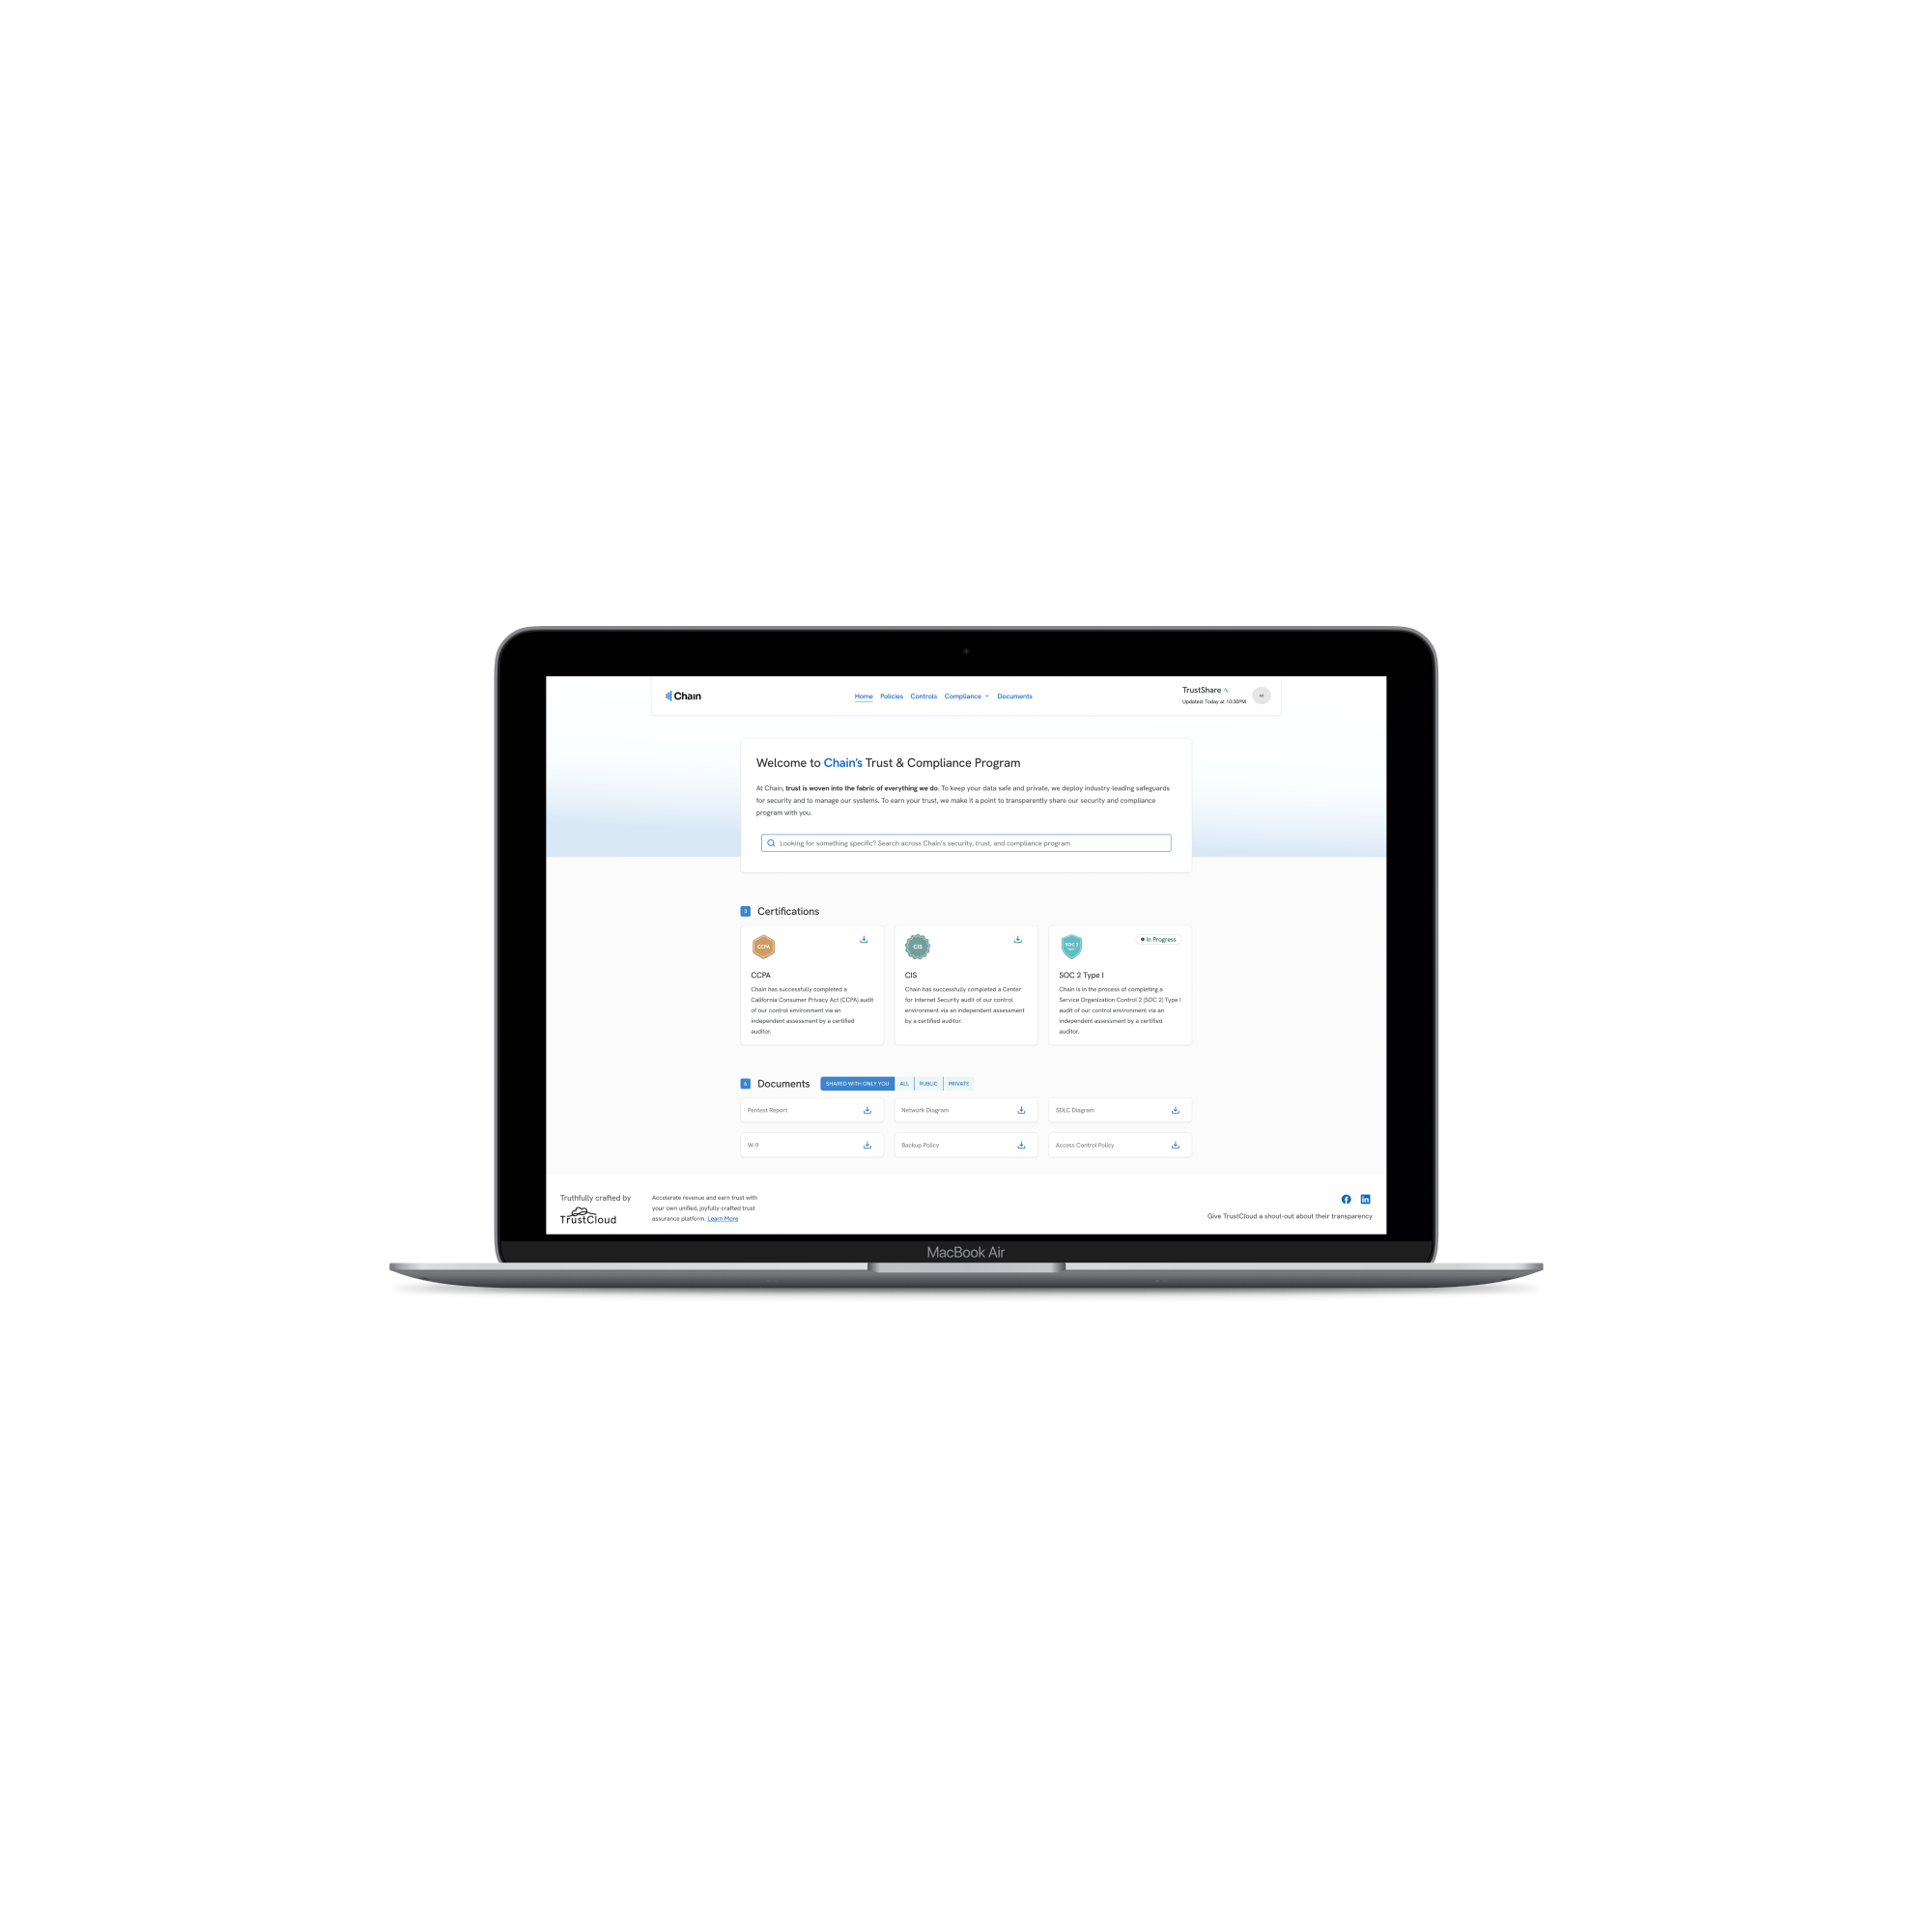
TrustShare Portal and Deal TrackerApplication Design
API Integration ApplicationEnterprise App Design
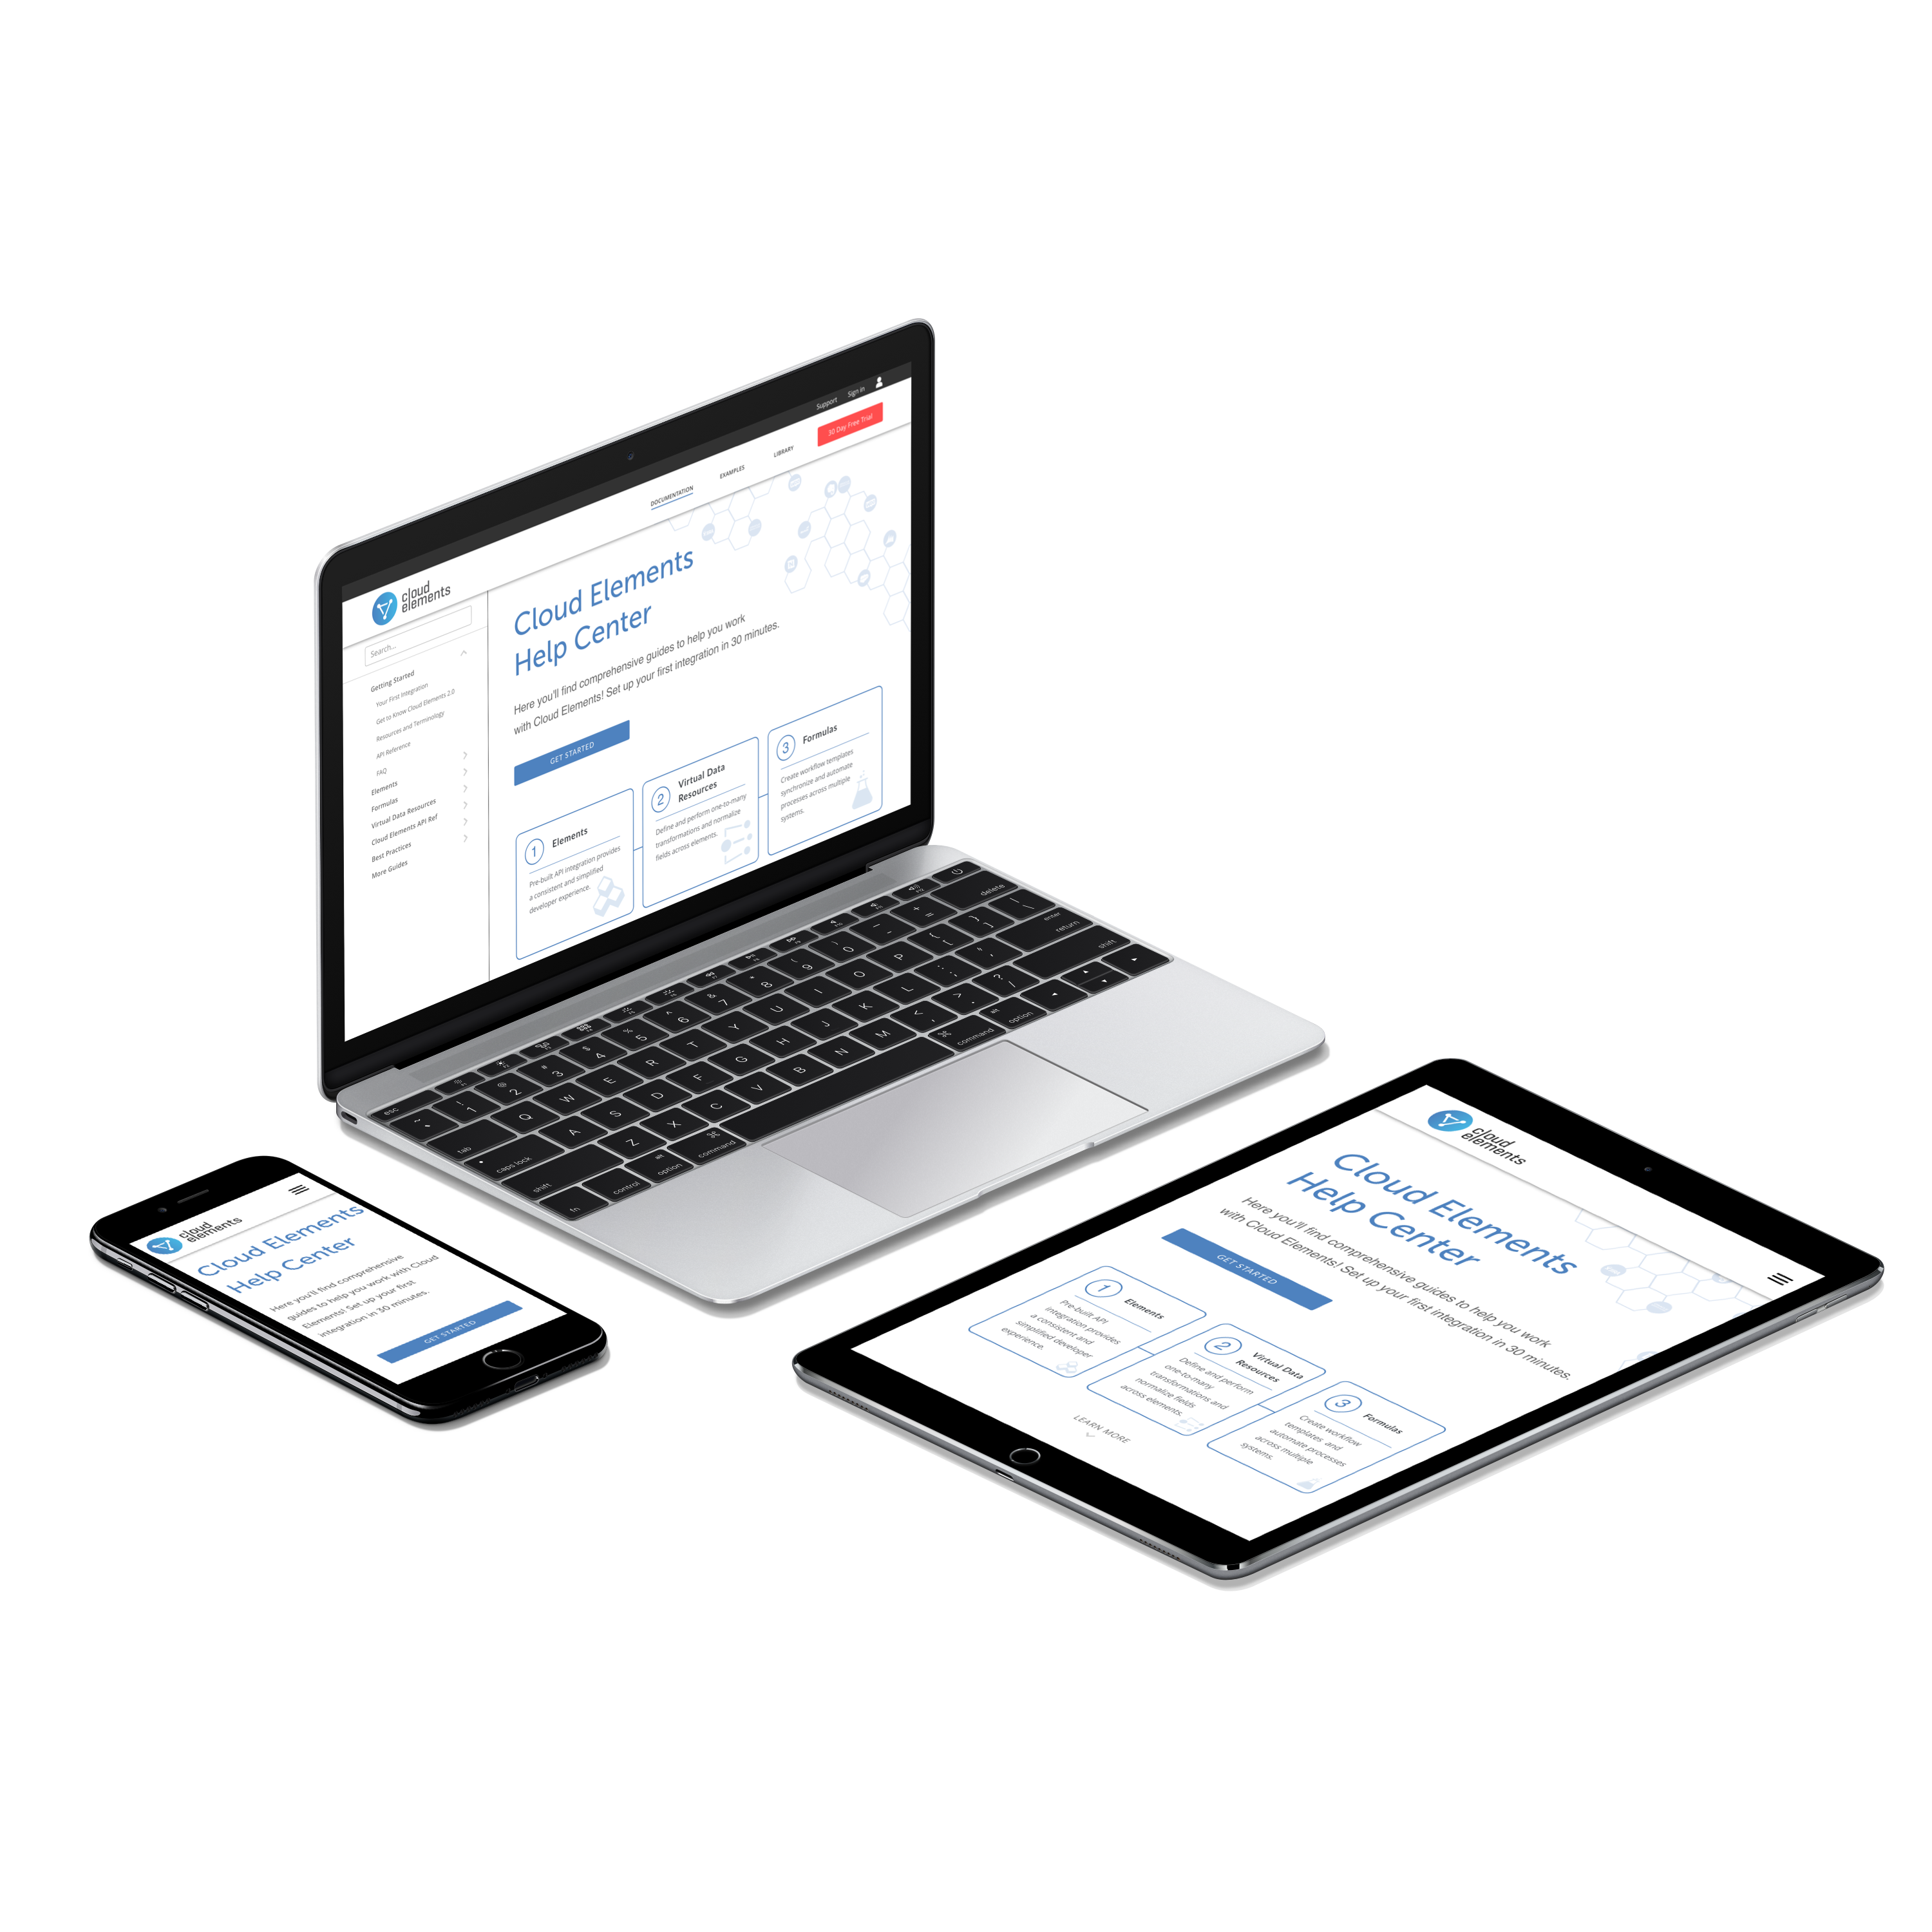
Cloud Elements Help CenterWebsite Design
Reading RecordiOS Design
Get in Touch